Sometimes we need to add some sepcial characters, like greek letters, into a figure with ggplot. The common way is using the function ‘expression’ in ggplot. However, it is tricky when you want to combine special charcters and replace a parameter with real value in the expression at the same time.
For example, we need to generae figures in a for loop. In each iteration of the loop, a value is calculated and then we want to put it into x or y lab.
In this case, we can use the function ‘bquote’. The difference between ‘bquote’ and ‘expression’ is shown below:
library(ggplot2)

set.seed(123)
dplot <- data.frame(x=rnorm(100), y=rnorm(100))
xval = "X"
yval = "Y"
xlab <- bquote(.(xval) ~ "(mu "*mu*" g^2)"*g^2)

ggplot(dplot) + geom_point(aes(x=x, y=y)) +
  labs(x=xlab, y = expression(yval ~ integral(f(x)*dx, a,b))) +
  theme_classic()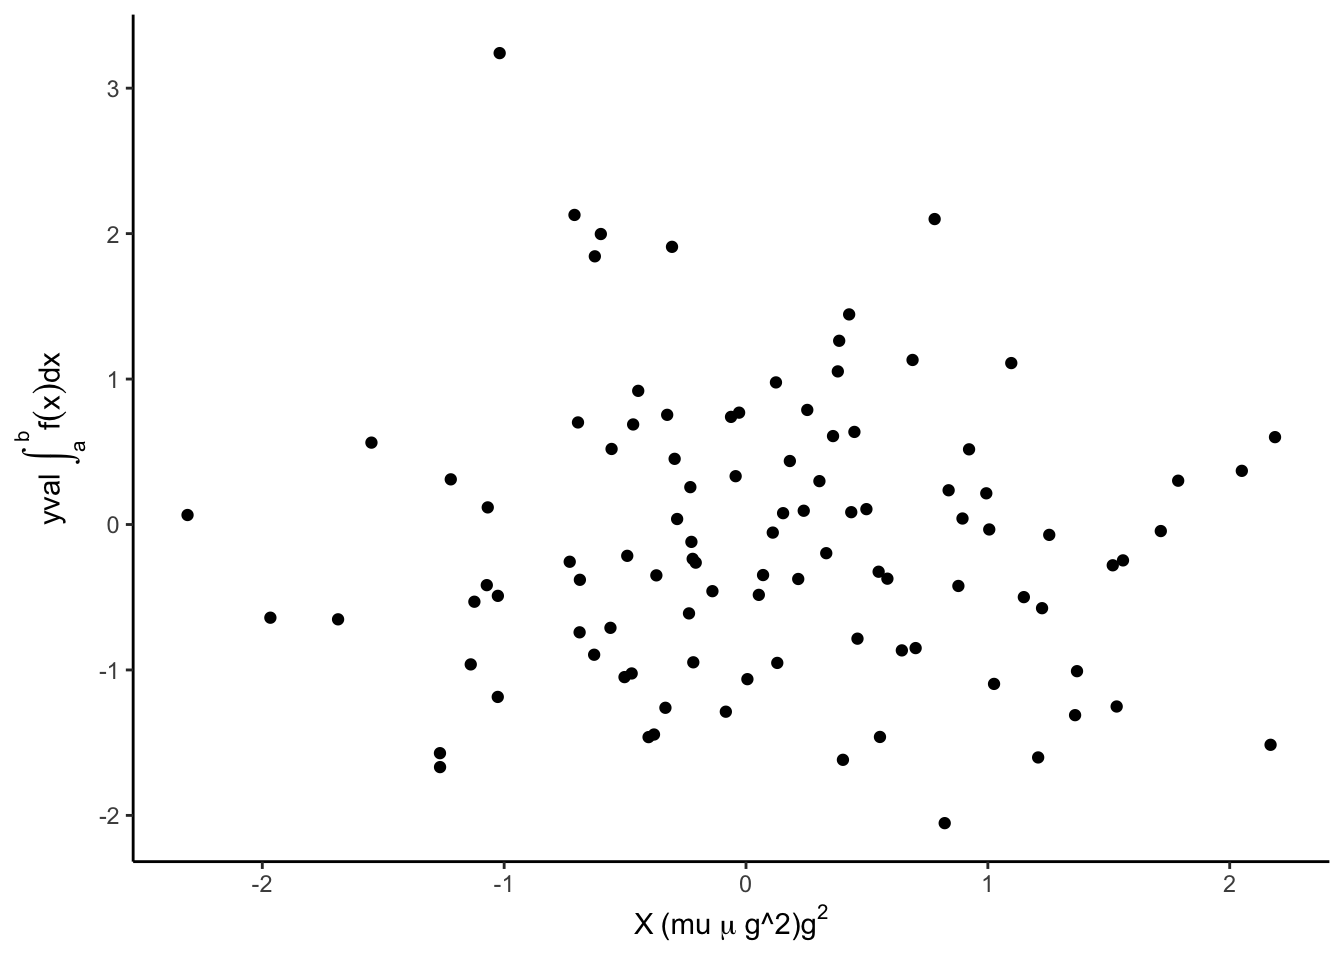
We can see that in ‘expression’, yval is not replaced by its real value Y here, while xval is replaced by its real value X in ‘bquote’. And in ‘bquote’, everythin in quote will keep the same. The difference between g^2 and g2 in xlab.
In summary, using ‘expreesion’ with ‘paste’ is recommended and using ‘bquote’ when you need to substitute parameter with its real value.